STORE INTELLIGENCE · RANDY NELSON · MARCH 2020
U.S. iPhone Users Spent An Average of $100 on Apps in 2019, Up 27% from 2018
Sensor Tower Store Intelligence finds that American consumers spent 36% more on apps in 2018 versus 2017 per active iPhone.

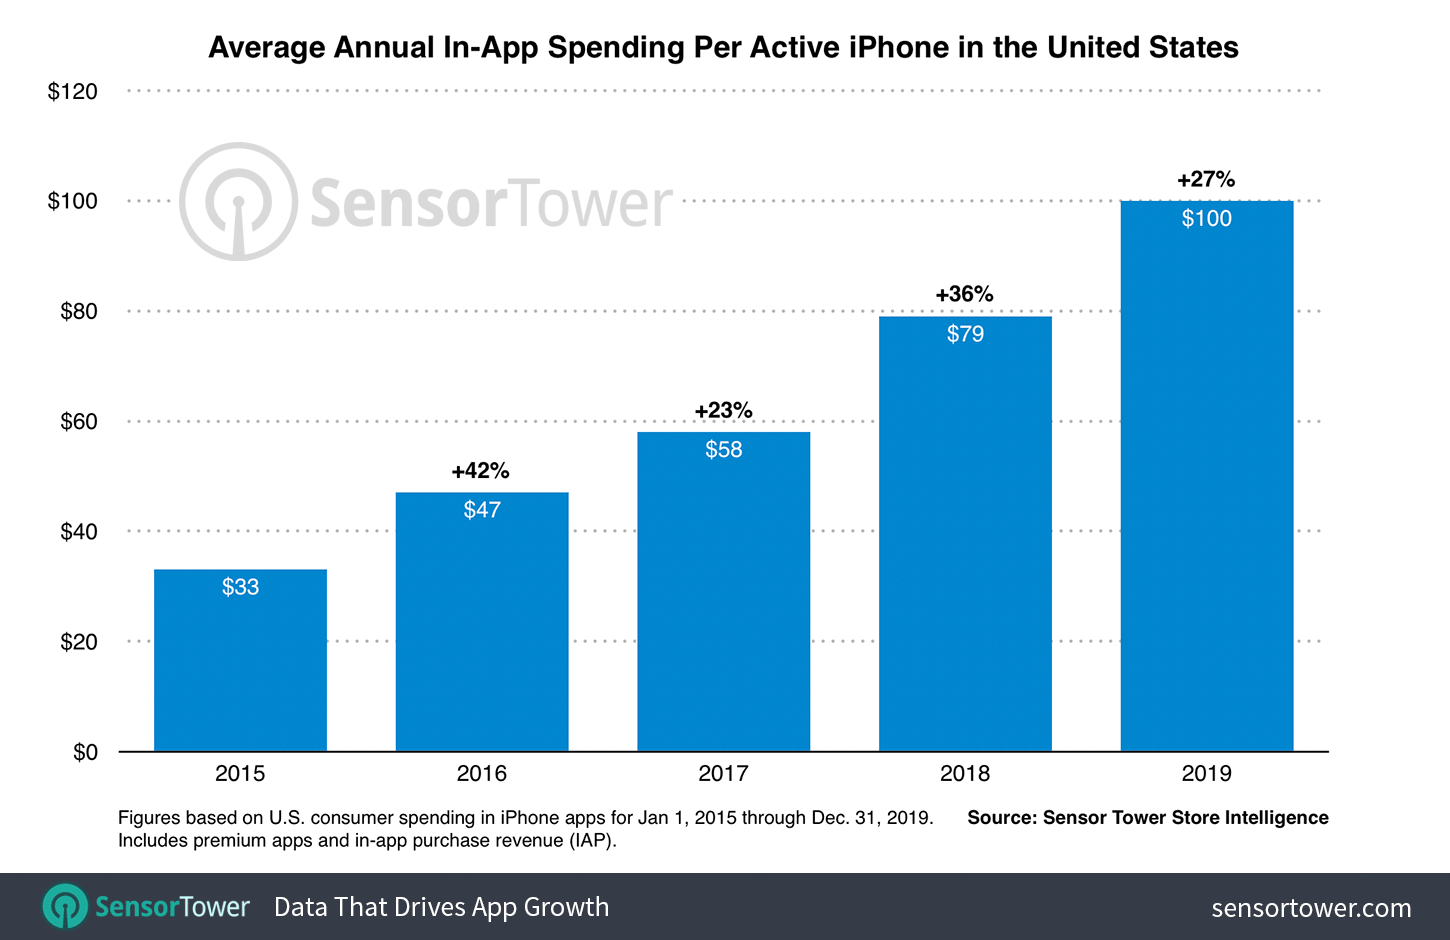
Consumer spending per active iPhone reached a key milestone in the United States during 2019, with the average amount spent on in-app purchases (IAP) and premium apps reaching an estimated $100 for the first time. This was $21 more than the $79 we found was spent on average in 2018. Note that these figures do not include spending in commerce apps such as Amazon, rideshare apps like Uber, or other apps where purchases are not processed directly through Apple and the App Store.
In this report, based on Sensor Tower Store Intelligence data, we explore which categories of apps contributed most to this spending and how consumer behavior changed in the year since our last analysis.
Average Revenue Per Active iPhone
In-app spending per U.S. iPhone grew 27 percent year-over-year in 2019, compared to 36 percent between 2017 and 2018, owing to continued market maturation and growing saturation of smartphone ownership among consumers. This Y/Y growth was considerable nonetheless, and speaks to the sustained health of the iOS ecosystem in the U.S. where spending continues to increase at a rate outpacing adoption of devices by first-time users.
Since reaching $33 in 2015, annual U.S. consumer spending in apps on a per-device basis has grown 203 percent at a compound annual growth rate (CAGR) of 31.9 percent.

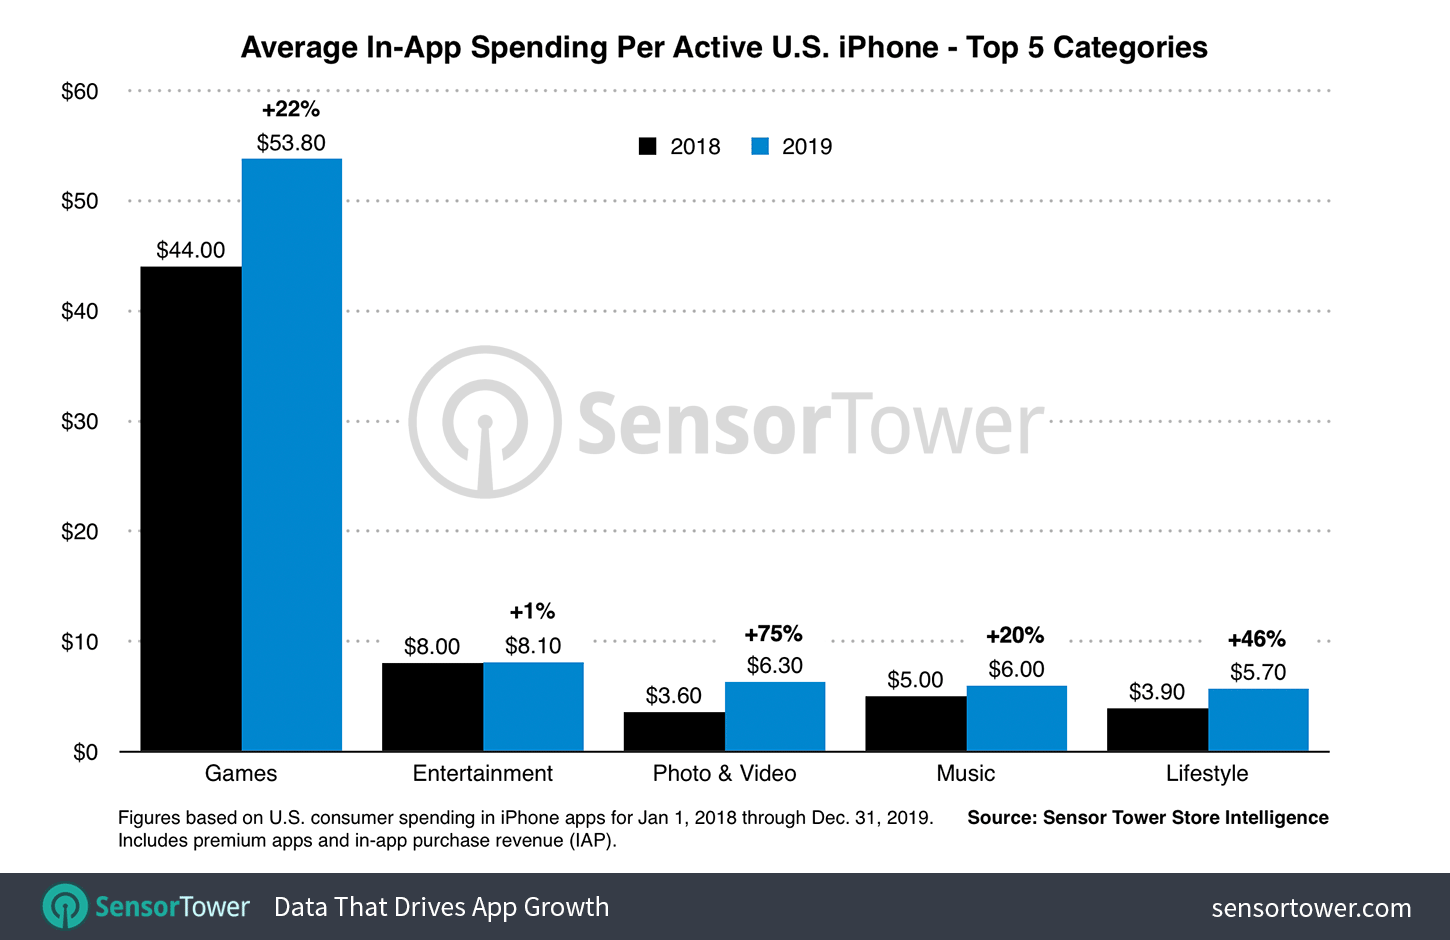
Mobile games represented close to 54 percent of U.S. per-device spending in apps last year at an estimated $53.80, an amount that grew 22 percent Y/Y from $44 in 2018. This growth mirrors the 22 percent increase in per-device spending on games seen between 2017 and 2018, when the amount grew from an average of $36. Consumer spending in iOS games per active iPhone has increased nearly $31 from an average of $23 in 2015, an increase of almost 134 percent.
Top App Categories By Average Spending Per iPhone
Per-device spending in mobile games grew significantly last year, but was eclipsed in terms of growth by Photo & Video among the top five categories for average amount spent. The category, which included the likes of streaming video platform YouTube and photo editor PicsArt among its top-earning apps in 2019, accounted for $6.30 or 6.3 percent of the $100 average spent by U.S. iPhone users last year, up 75 percent from $3.60 in 2018.
Lifestyle, a category which features many popular dating apps such as Tinder, saw its per-device average increase 46 percent over 2018, growing from $3.90 spent per device to $5.70. Health & Fitness, albeit outside the top five at No. 7, grew its average by 48 percent to $4 thanks to increased spending in meditation apps such as category leader Calm.

All of these category-leading apps rely primarily on subscriptions for monetization. In January, our research showed that this model is a growing driver of in-app spending, with U.S. App Store users having spent an estimated $3.6 billion in the platform's top 100 subscription-based apps during 2019 alone.
As more types of apps, including mobile games, continue to adopt subscriptions as a primary form of monetization, we expect the iOS ecosystem as a whole to better monetize in mature markets such as the U.S. Developers are discovering that subscriptions enable them to derive greater revenue from their hard-won user bases than traditional one-off IAP or premium price tags, given their apps are a good fit for this type of monetization. This is borne out by our findings that categories populated with prominent subscription-based apps display the largest Y/Y gains in per-device spending.
As for Apple, this $100 milestone and the substantial per-device growth it represents annually is further proof that iOS—and the developers that make it thrive—are a segment of its services business worth increasingly intense focus. Faced with results such as this, there continues to be no wonder why the company transformed its business around the iPhone and never looked back.
About The Data in This Report
The figures in this report are based on an estimate of active iPhone devices in the United States for calendar years 2015 through 2019, as produced by Sensor Tower. iPhone category and app revenue estimates for the corresponding period were generated by Sensor Tower's Store Intelligence platform.


